When analyzing data from multiple sources, we often find that the time series data doesn’t line up. This can be due to several reasons, such as time being set incorrectly before data acquisition, the use of multiple time sources to program the systems, and drift. Trying to line this data up in Excel is quite a tedious process. Every time we needed to analyze data from the field, we would spend hours trying to align data from sources such as EDR, directional module, batteries, and surface system. This is where Wave can help. Not only can you view data in Wave, but you can also time shift the different data sources. We’ll walk through the steps to align data from two different sources.
1. Load out the EDR and Micropulse files into Wave.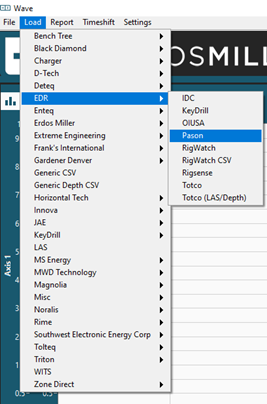
2. Add channels to grap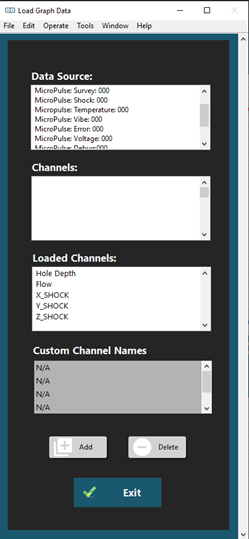
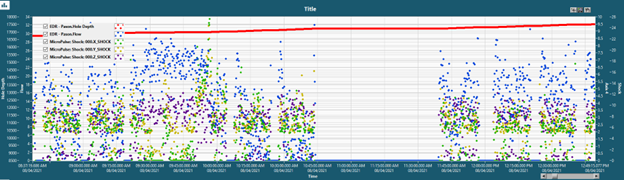
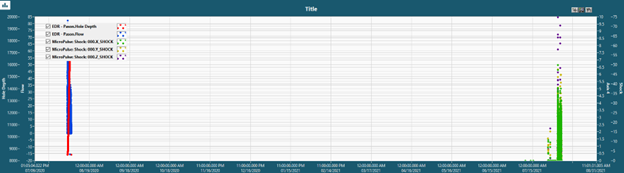
3. Map the channels to the correct axis and view the data. We can see that the data isn't lining up correctly and it seems to be off about 1 year.
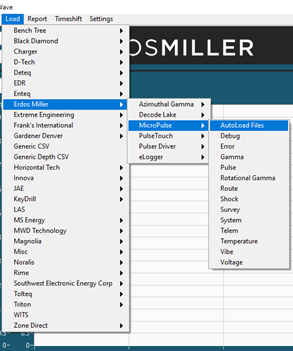
4. Navigate to the Timeshift menu option and select Generic Timeshift.
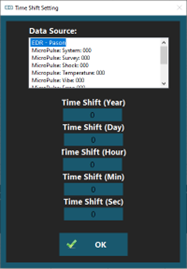
5. Select the data source you would like to shift. In this case, shifting the EDR data would be the easiest and will shift by 1 year.
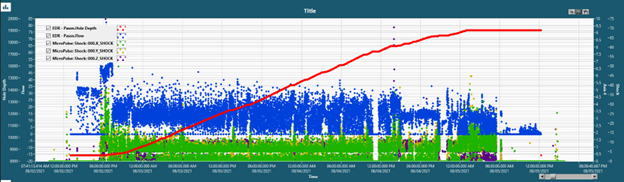
6. For some data, additional adjustment may be required. For this data, I was able to match up a no flow section in the EDR data with a no shock section. Below is the data zoomed in on that section and we can see that when there is no flow in the EDR data, the Micropulse shows 0g for shock. Also, during this time, hole depth is not changing.