LabVIEW is a language most used to acquire data and display it on a user interface. This process is often described using the following three terms: (1) acquisition, (2) analysis and (3) presentation. Although the process is generally in the context of reading a couple of inputs and logging to a graph, it can also scale up by many orders of magnitude. Big data, put simply, is acquisition, analysis and presentation of a significantly larger data set in terms of time, number of individual data points or sources of the data set.
Any problem can be solved with an appropriate amount of data and an idea of how to use that data to generate a solution. Big data is a tool that can be used to solve a variety of problems with an end goal of reducing cost using the following process:
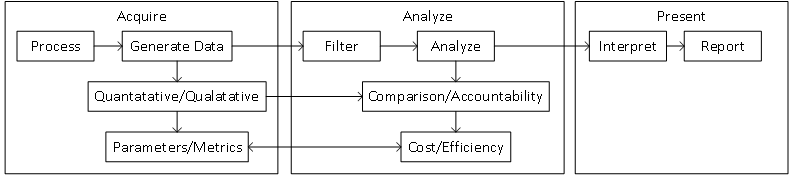
- Define process and parameters
- Select quantitative and qualitative parameters of the process to measure
- Identify tags to further identify those parameters (used for filtering)
- Use parameters to define metrics that can later be used after analysis
- Acquire process parameters
- Acquire parameters using data acquisition
- Acquire parameters as inputs for process automation
- Acquire inputs as time-centric real-world values
- Filter/Analyze big data
- Use filters to shrink the data set for focused trending
- Use metrics to quantify efficiency and cost
- Use human criteria to provide accountability
- Predictive Maintenance (PDM): An application can acquire data from a Unit Under Test (UUT) at regular intervals and constantly analyze to detect an acute failure or degradation of performance over time.
- Performance Analysis: Metrics can be used along with data acquired in real-time to create values representative of performance which can then be used to identify cost. This data could also be used to create a baseline to quantify the effect of process changes.
- Simulation Models: A simple model can be created by playing back acquired data or a more sophisticated model can be created using acquired data to create a statistically similar model. This model can be used to create a control algorithm without hardware and/or avoiding additional edge testing that could be destructive and/or expensive.